
Better Data Structures Printing (Debug Mode)
You might have seen that using Js.log to print records, variants and others don't print out record field names and variant tags. Record, for example, is compiled into an array (the field names are removed). This is partially for performance, and partially because of [insert excuse here].
To remediate this, we introduce a flag for bsc (the BuckleScript compiler), -bs-g, that retains record fields names, variant tags, exception names, module names, etc.
| Before | After |
|---|---|
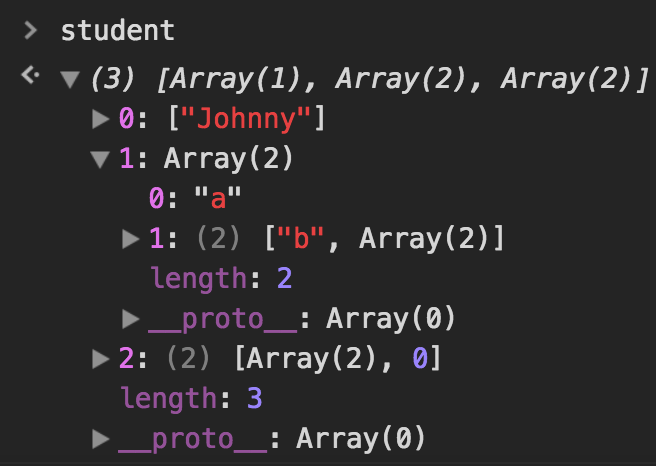
|
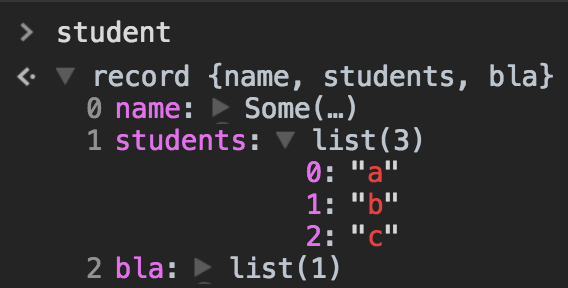
|
Note: this is for debugging only. Please don't forget to undo this for production.
Usage
- Add
"bsc-flags": ["-bs-g"]to yourbsconfig.json. - In the BuckleScript/Reason file you'd like to debug, add
[%%debugger.chrome]at the top *. - If you're on Node.js, run:
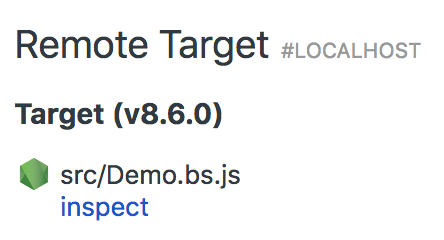
node --inspect-brk MyCompiledFile.jsand open this URL in Chrome:chrome://inspect. - Make sure you've got Chrome custom formatter enabled.
- Click on inspect, then step through code as you would usually:
This custom formatter is still experimental; feel free to contribute to it here!
Note: you need to restart node every time your files changes.
Note: don't forget to remove -bs-g from your bsconfig.json for production!
Tips & Tricks
Here are other ways to debug using node/Chrome.
* The extension [%%debugger.chrome] conditionally turns on the debugger support. Feel free to keep it on at all time; it will not generate any extra garbage code unless you have -bs-g flag turned on above.